The Adobe Education Exchange is a free online community for Primary/Secondary and Higher Education faculty and staff to meet, share, discuss, and collaborate on topics of interest to the Adobe education community.
Get Started for FREE
Sign up with Facebook Sign up with X
I don't have a Facebook or a X account


 Your new post is loading...
 Your new post is loading...
Your new post is loading...
The Adobe Education Exchange is a free online community for Primary/Secondary and Higher Education faculty and staff to meet, share, discuss, and collaborate on topics of interest to the Adobe education community. 
No comment yet.
Sign up to comment
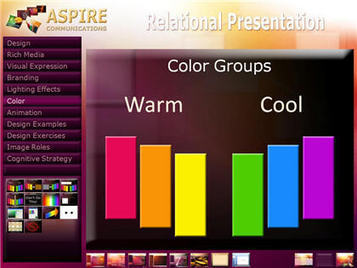
The color combinations you place on slides significantly affect their visual impact and appeal. Keep in mind the following characteristics: Reds, oranges, and yellows are referred to as warm colors. They tend to... Via Baiba Svenca

“Information can be useful -- and even beautiful -- but only when it’s presented well.” So how do you go about creating such an amazing infographic? I have 9 steps that may just help you.
Read more: http://blog.mindjet.com/2012/07/9-step-guide-to-creating-marvelous-infographics/
Via Gust MEES
A useful and very comprehensive resources around using and creating infographics. Books, online tutorials and resources and a range of samples.

"The Photos app in iOS includes a built-in crop tool that works very well for quick edits on the go with the iPhone, iPad, or iPod touch. Perhaps even better, there’s a constraint tool that lets you instantly crop images to a variety of common photo proportions, ranging from a perfect square, 4×3, 8×10, 5×7, 16×9, and others taking the guesswork out of the process. No additional downloads or apps required, it’s all featured in the default Photos app." Via John Evans

Jeremy Hill's comment,
January 22, 2019 2:31 AM
How to search for people, places, animals, and things in iPhone and iPad? https://www.scoop.it/t/iphone-by-refurbishediphone/p/4104839034/2019/01/22/how-to-search-for-people-places-animals-and-things-in-the-photos-ap
TED Talks David McCandless turns complex data sets (like worldwide military spending, media buzz, Facebook status updates) into beautiful, simple diagrams that tease out unseen patterns and connections. Good design, he suggests, is the best way to navigate information glut -- and it may just change the way we see the world. David McCandless draws beautiful conclusions from complex datasets -- thus revealing unexpected insights into our world.
How can we visualize our learning: attend to information, recognize patterns, attach new ideas into existing mind fabric, & transfer etc? (Kathy Zhao)

IT'S that time of year when we turn our thoughts to winter frugality. What's the most we cheapskates can get for nothing?
For Windows and Linux, there are enough freebies to handle image viewing and editing that it is possible to process digital images without spending a cent.

PowerPointStyles.com offers you a great collection of Powerpoint templates, models and backgrounds. All our themes and designs are free to download. Via Baiba Svenca

Discover how the colors you choose for your visuals can guide the emotional response of your audience. Via Baiba Svenca

With the help of this screen magnifying software, the presenters can zoom in and highlight any section of the screen for making it clear to the viewers. Via Baiba Svenca
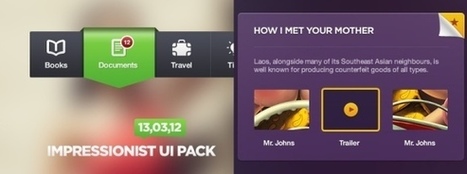
If you are looking for a free alternative to Prezi, then try Impress.js and Impressionist. Impress.js is a free presentation tool inspired by the Prezi platform that can be used for creating attractive presentations. Via Baiba Svenca
|

|
Rescooped by Kim Flintoff from visual data |
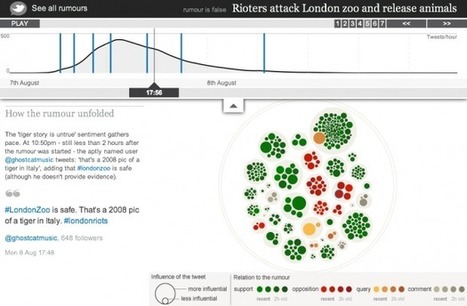
Have you ever wondered how today’s beautiful visualizations are created? If you Google ‘process of creating a data visualization’, you’d be hard-pressed to find a good resource that describes it. And maybe the reason is that there is no such process — not a formal one, anyway.
Despite not having a required set of steps, here are three stages that the visualization creation proces goes through...
|
|
Rescooped by Kim Flintoff from Data Visualization Topics |

It is important to keep your blog readers and website visitors interested in the information you share. Coming up with creative and eye-catching ways to grab the attention of online users is extremely crucial in having people visit and return to ...
|
|
Rescooped by Kim Flintoff from Digital Presentations in Education |

Stipple lets you put information inside your images. It links your images back to you wherever they go.


|
Suggested by Learning Futures |

Although no one can say that visuals are always superior to words, the principle known as the picture superiority effect should convince you that using effective visuals will improve learning. The principle states that people generally have a better memory for pictures than for corresponding words.
|
|
Scooped by Kim Flintoff |


Gephi is a tool for people that have to explore and understand graphs. Like Photoshop but for data, the user interacts with the representation, manipulate the structures, shapes and colors to reveal hidden properties. The goal is to help data analysts to make hypothesis, intuitively discover patterns, isolate structure singularities or faults during data sourcing. It is a complementary tool to traditional statistics, as visual thinking with interactive interfaces is now recognized to facilitate reasoning. This is a software for Exploratory Data Analysis, a paradigm appeared in the Visual Analytics field of research.
|
|
Rescooped by Kim Flintoff from Into the Driver's Seat |

By Daniels Mekss
Excellent collection of free tools for developing charts and diagrams. Mekss has gone out of the way to gather a very powerful set of free tools. This is definitely worth checking out. -JL
|
|
Rescooped by Kim Flintoff from we-Learning |
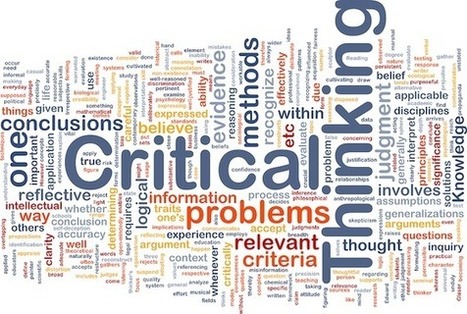
"As a child, I grew up in a world that was dominated by left-brained thinking. Both my parents were in professions that required in-depth analytical thinking. The “rule” in my house was: “If you break something, try to fix it. Only THEN come ask Dad for help.”
Looking back now, I realize something I never understood then — what he had instilled was an ability to think critically. Along with creativity, collaboration, and communication, critical thinking is one of the four components of learning in the 21st century. Unlike the other three, critical thinking is often difficult to reduce to bite-size pieces of understanding and challenging to teach to others."
Read on for an example of teaching critical thinking with a first grade class as well as a look at 3 underlying components to critical thinking.

|
|
Rescooped by Kim Flintoff from Into the Driver's Seat |

Description by edtechteacher
"No longer do images that teachers and students use for presentations have to be static presentations. Thinglink is a new web tool that allows images to be uploaded and tagged with hot spots. These hot spots can be text, links to web based content, or YouTube videos. When the image is viewed online, the hot spots become click-able and reveal the embedded content. Thinglink allows for a completely new approach to using images in the classroom and provides a new medium by which students can present image based content for projects or assignments.:

|
Rescooped by Peter Mellow from Digital Presentations in Education |
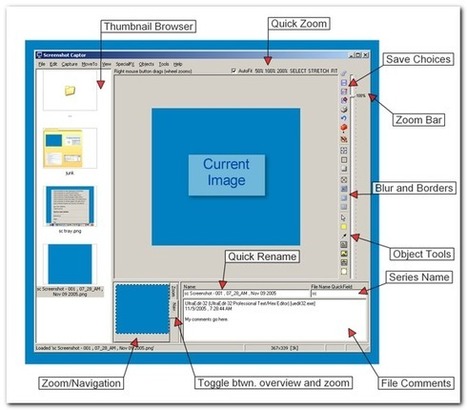
Screenshot Captor is a best-in-class tool for grabbing, manipulating, annotating, and sharing screenshots. It's different from other screenshot utilities in several notable ways...
|
|
Rescooped by Kim Flintoff from Digital Presentations in Education |
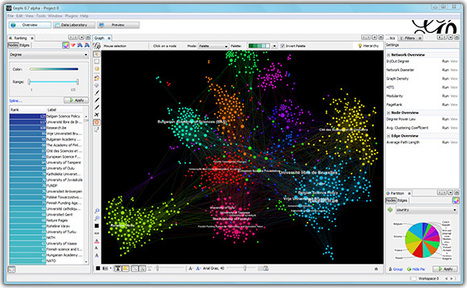
Gephi is an open-source software for visualizing and analyzing large networks graphs. Gephi uses a 3D render engine to display graphs in real-time and speed up the exploration.
|
|
Rescooped by Kim Flintoff from Curation, Social Business and Beyond |
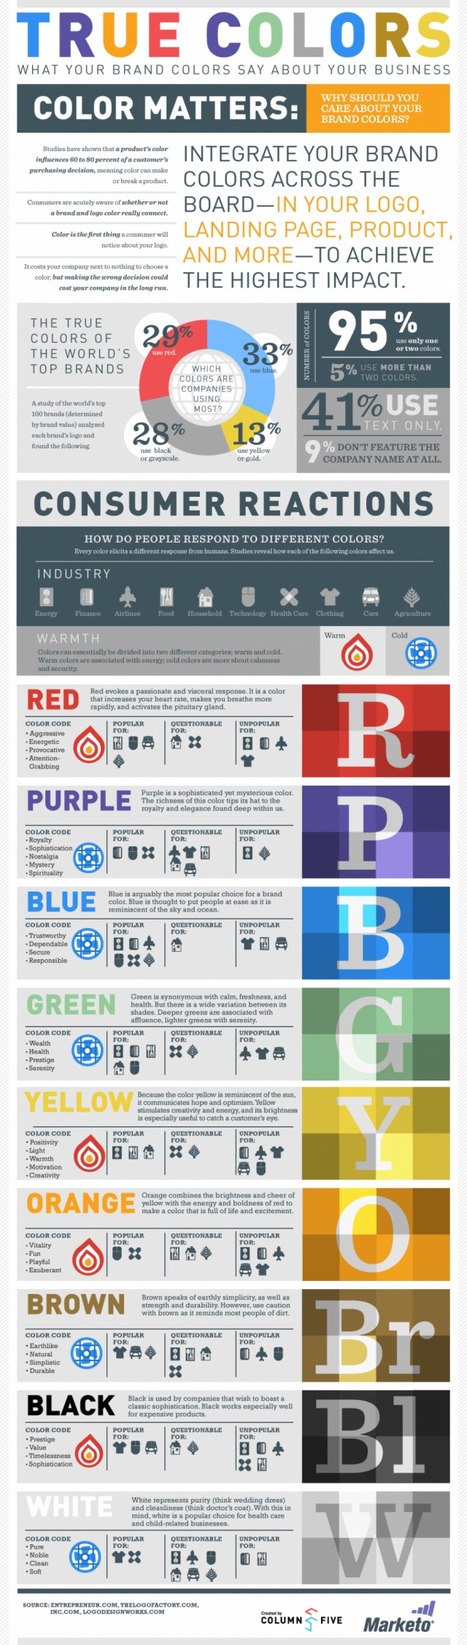
This article and infographic posted by Chelsey Kilser and Daily Infographic and is about the of findings from Entrepreneur, TheLogoFactory and Logodesignworks.
Jan Gordon:
Effective social business requires a strong brand message, great content and the ability to build community through deeper engagement and is first and foremost. However, the way you package your services matters and the colors you use are very important.
Excerpt:
"Colors matter and they are one of the factors that keeps your company standing out, gives your company a voice and gives you leverage over other similar companies."
Here are a few takeaways:
**The true colors of the world's top brands:
*29% use red
*33% use blue
*13% use yellow
*28% use black or grayscale
**Good information about how people respond to different colors
Here are just a few:
*Red is agressive, provacative, attention-
grabbing
*Purple signifies royalty, sophistication, mystery
*Black means prestige, value, timelessness
*Brown is earthlike, natural, simplistic
Selected by Jan Gordon covering "Content Curation, Social Business and Beyond"
See article and infographic here: [http://bit.ly/OjaJjM]
|
|
Scooped by Kim Flintoff |
Piktochart- Make Information Beautiful. Create infographics. Engaging presentation app.
Have graphics tell a story from your information. Infographics are an awesome way to tell stories out of data. With a lite set of professional design tools, Piktochart helps you create wow presentations to engage your web audience. Combine themes, shapes, icons, vectors, text, uploaded images, chart exporter (8 types of visualizations) to create the story you want.
|
|
Rescooped by Kim Flintoff from Digital Presentations in Education |