Distance Learning, mLearning, Digital Education, Technology
12.1K views | +2 today
Follow
Distance Learning, mLearning, Digital Education, Technology
Your new post is loading...
Scooped by Dennis Swender
Scoop.it!

Python vs Java: Which is better and How to Choose?

Still confused to choose the best programming language for data science? If yes, then check out this presentation to know which one is best between Python vs J…
No comment yet.
Rescooped by Dennis Swender from Daily Magazine
Scoop.it!

How Educational Technology is Reshaping Education: Latest Trends

How Educational Technology is Reshaping Education: Latest Trends | Distance Learning, mLearning, Digital Education, Technology | Scoop.it
Technological advancements, have an instrumental role to play for the future of education. Get into the know of the latest trends.

Via THE OFFICIAL ANDREASCY
THE OFFICIAL ANDREASCY's curator insight, November 18, 2018 1:03 PM

Education is going digital! Do you agree? What would you add?

yara yn's curator insight, November 24, 2018 11:39 AM
AR VR and 3D changes the learning experiences 
Rescooped by Dennis Swender from Big Data + Libraries
Scoop.it!

Big data can’t bring objectivity to a subjective world

Big data can’t bring objectivity to a subjective world | Distance Learning, mLearning, Digital Education, Technology | Scoop.it
It seems everyone is interested in big data these days. From social scientists to advertisers, professionals from all walks of life are singing the praises of 21st-century data science.

Via Elizabeth E Charles
No comment yet.
Scooped by Dennis Swender
Scoop.it!

A Brief Overview of Big Data Technologies, Applications & Best Practices

A Brief Overview of Big Data Technologies, Applications & Best Practices | Distance Learning, mLearning, Digital Education, Technology | Scoop.it
Big Data Technology is a data collections term that are too large or difficult for common data-processing application software to deal with well.
No comment yet.
Rescooped by Dennis Swender from Big Data + Libraries
Scoop.it!

10 definitions of datafication (in education)

10 definitions of datafication (in education) | Distance Learning, mLearning, Digital Education, Technology | Scoop.it
What is datafication? And how does it affect education? These questions were put to me ahead of conference discussion panel recently. While writing a few notes, it quickly became apparent I needed some categories to sort out my thinking. In simple terms, datafication can be said to refer to ways of seeing, understanding and engaging with the world through digital data. This definition draws attention to how data makes things visible, knowable, and explainable, and thus amenable to some form of action or intervention. However, to be a bit more specific, there are at least ten ways of defining datafication.

Via Elizabeth E Charles
Madelyn Zhang's comment, July 10, 2023 5:04 AM
NICE
Situs KOITOTO's comment, December 28, 2023 6:33 AM
GOOD
BrijbagLaw's comment, January 22, 4:26 AM
nice
Rescooped by Dennis Swender from Presentation Tools
Scoop.it!

A Curated Collection of All the DataViz Methods: The Data Visualization Catalogue

A Curated Collection of All the DataViz Methods: The Data Visualization Catalogue | Distance Learning, mLearning, Digital Education, Technology | Scoop.it
If you've ever struggled with what visualization to create to best show the data you have, The Data Visualization Catalogue might provide just the help you

Via Robin Good
Robin Good's curator insight, February 2, 2014 5:47 AM


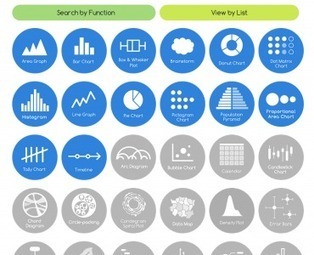
The Data Visualisation Catalogue is an on-going project developed by Severino Ribecca which attempts to index and catalogue all of the data visualization approaches available, in order to help journalists, designers and professional communicators identify more easily the type of data visualization most appropriate for their needs.

.

In the Catalogue there are now over 50 different data visualization approaches that have been identified, and about a third of them have also been documented with a basic description, visual examples, relevant tags to associate it with their possibe best uses, variations, and with a list of alternative tools available to create that type of data chart.

.

You can browse the catalogue also by using the "Search by Function" which is designed to aid in choosing the appropiate data visualization approach based on the specific communication need at hand, or with the "View by List" approach, which organizes dataviz methods by types. 

.

My comment: Excellent resource for visual communicators of all kinds as it helps you see the great variety of dataviz approaches available. It makes it easier to identify and select relevant solutions according to needs and use.

.

Check it out: http://blog.visual.ly/the-data-visualization-catalogue/ 

.

.


Hat Tip to @LelioSimi


Una Sinnott's curator insight, February 2, 2014 4:54 PM

A great collection of data visualisation tools, categorised by the characteristics of the data you want to show.

Juliana Elisa Raffaghelli's curator insight, February 19, 2014 7:14 AM

Rappresentare: raccontare la realtà in modo tale da attrarre in modo efficace l'attenzione del nostro interlocutore/lettore. In una società iperconnessa e dialogica, fondamentale competenza.