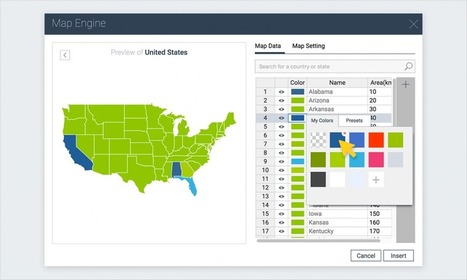

A step-by-step tutorial on how to create an interactive map with Visme, a free online infographic and presentation tool.
Via Micheal polands
Get Started for FREE
Sign up with Facebook Sign up with X
I don't have a Facebook or a X account


 Your new post is loading...
 Your new post is loading...
Your new post is loading...
A step-by-step tutorial on how to create an interactive map with Visme, a free online infographic and presentation tool. Via Micheal polands 

Tom Cockburn's curator insight,
December 13, 2016 3:55 AM
Create your own maps

António Leça Domingues's curator insight,
December 19, 2016 6:44 AM
Criar um mapa interativo com Visme.

Bart van Maanen's curator insight,
December 19, 2016 10:02 AM
Mooie tool om een kaart van data te voorzien.
Sign up to comment
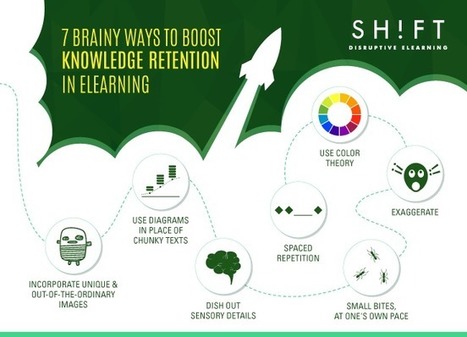
As instructional designers, you have to create courses that are easy to remember and difficult to forget. Here's how: Via Beth Dichter

Beth Dichter's curator insight,
April 25, 2015 8:05 AM
When we think of ways to boost knowledge retention in our learners, what works for students that are online also works for students in face2face classes. This post from SH!FT provides seven ways to help student retain knowledge. The visual above illustrates the concepts. The post provides additional information as well as links to #1 - When possible, use diagrams. Many people are visual learners. Consider using graphic organizers to provide "holistic views, expressing relationships, and identifying contrasting data." #2 - Incorporate unique and out-of-the ordinary images. Why? Images stay with us longer, and the more unique, the longer they tend to stay with us. #3 - Dish out sensory details. The more details that engage the learner the better. #4 - Use color therapy. Color works on many levels. Color can be used to organize, to grab our attention, and it can impact our mood. The last 3 suggestions are below...but you will need to click through to the post to learn more about each. #5 - Exaggerate. #6 - Small bites, at one's own pace. #7 - Spaced repetition. |
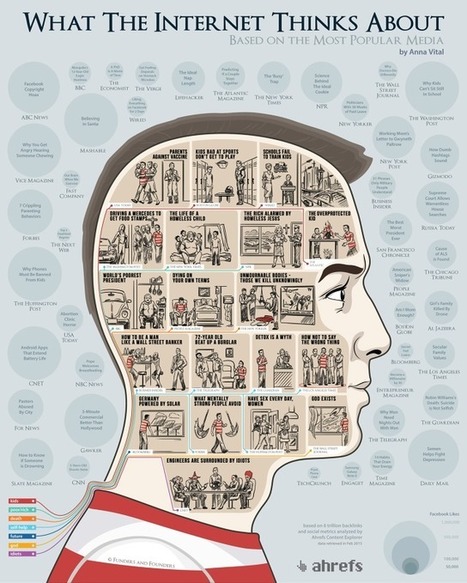
What does the Internet care about? What articles do we share the most? Using the data from the Ahrefs Content Explorer, the people at Funders and Founders Via Lauren Moss

Emilio Ruano's curator insight,
May 4, 2015 1:17 PM
At least, the concern about equality, energy and social welfare is there. I like the last one about engineers tho. Hahaha. 
Mackenzie Hamilton's curator insight,
October 13, 2015 8:36 AM
I think this article is awesome because they use data visualization to show what people share the most, visit the most, and search the most. Data is everywhere and people are using it everyday and sometimes don't even think about it.

NASA visualizes the 22,000 tons of life-giving dust that flows between Africa and South America. Via Lauren Moss
|