
Have a look at the top 7 statistics graphs to represent the data set like a pro. Here we have mentioned everything about these statistics graphs
Get Started for FREE
Sign up with Facebook Sign up with X
I don't have a Facebook or a X account


 Your new post is loading...
 Your new post is loading...
Your new post is loading...
Have a look at the top 7 statistics graphs to represent the data set like a pro. Here we have mentioned everything about these statistics graphs 
No comment yet.
Sign up to comment

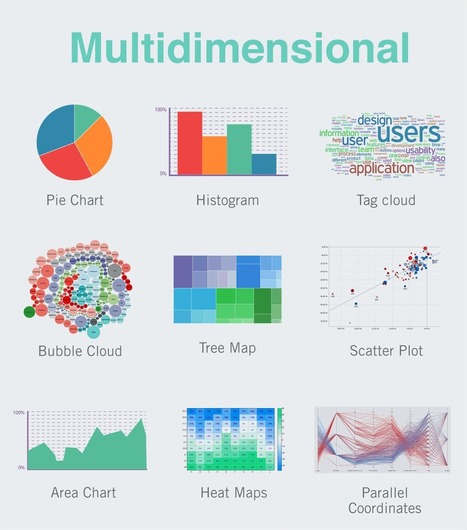
In our Data Visualization 101 series, we cover each chart type to help you sharpen your data visualization skills.Scatter plots have been called the “most versatile, polymorphic, and generally useful invention in the history of statistical graphics” (Journal of the History of the Behavioral Sciences, 2005). That’s a big claim, but just as their name implies, they can take a confusing and scattered set of data and make sense of it. As such, these plots are much more than a visualization tool; they are a discovery tool. Let’s look at what makes the scatter plot so good... Via Lauren Moss

Christopher Higgins's curator insight,
July 18, 2015 6:17 AM
A quick history of graphing information and how scatter plots are unique from other ways of graphing in more than one way. A great visual of the different types of relationships that are easily identified on a scatter plot, highlighting why scatter plots are so useful to understand relationships between two different variables. |
Data is the supportive brick for any presentation or report out there. It offers bits of reality that together form an accurate image. Via Elizabeth E Charles

A look at infographics that brilliantly display data using physical objects, a technique that can simplify information. Via Lauren Moss

Davies Blake's curator insight,
May 28, 2020 1:40 PM
buy stiizy pod
buy smartbuds buy pre rolls 10 thca diamonds free!! facts of white widow Foreverkush.com has a 30% discount going on from 1st till the 15th of April due to the outbreak of corona virus. please stay home place, your orders |