Visual Skills to the ticket out of being overwhelmed
--------------
This piece was posted by Loren Sorenson for Hubspot, I selected it because as she says "If you aren’t prepared for the visual content revolution, you may be left in the dust.
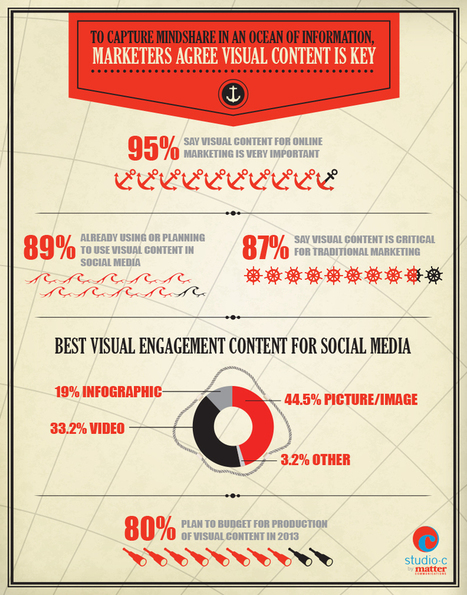
Not convinced? Let's take a look at exactly how visual contentis positively contributing to marketing strategies -- it may just give you the push you need
"Learn why visual content is a critical part of your content creation strategy.
Here are some highlights:
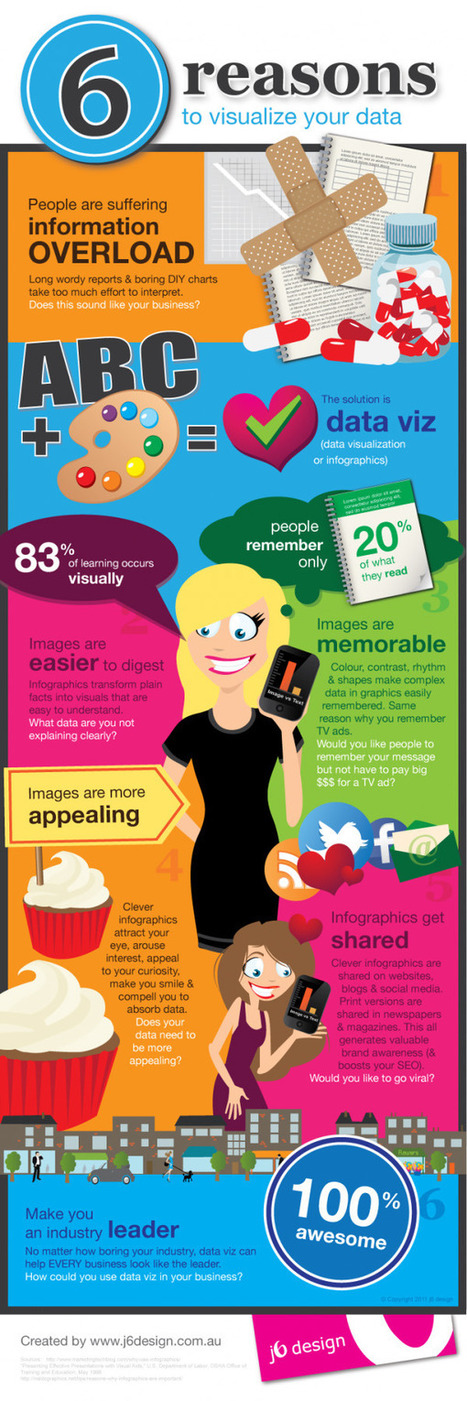
**People remember only 20% of what they read
**83% of learning is visual
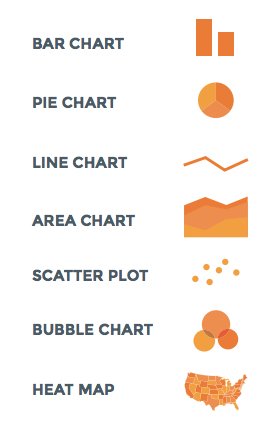
Condenses and Explains Large Amounts of Information
**Today, there is too much information on the Internet you have about 3 seconds to catch someone’s eyes so they'll consume your information.
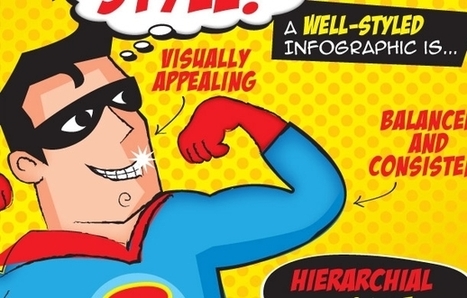
Gives Your Brand an Identity
**Visual content draws people in, letting viewers better understand your brand's identity
Drives User Engagement
**If you've ever read a book with a child, you probably know they find pictures more interesting than words; but are adults really that different?
Selected by Jan Gordon covering "Content Curation, Social Business and Beyond"
Read full article here: [http://bit.ly/Ifujbp]
Via
janlgordon


 Your new post is loading...


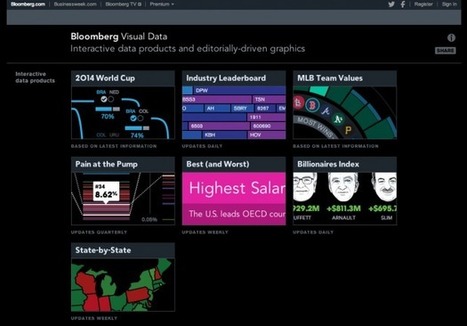
Infographics, data visualizations, and interactive visual projects are popular for a reason. They capture imaginations, command attention, and teach new things. Above all, however, they are simply fun to look at. If you’ve spent some time getting lost in all of the projects on Visually’s community page, you know what I mean. As visual content has exploded in popularity over the past few years, so have the places to discover the best ones. Check out five of our favorites below.